Create network charts with Airgraph-ng
Airgraph-ng is an instrument to create charts to envision information caught via airodump-ng. It can make two kinds of charts:
CAPR: Client — Access Point Relationship, demonstrating every one of the clients associated with the distinctive access points.
CPG: Common Probe Graph demonstrates a diagram focused on tested ESSID and gadgets MAC that probed them.
To install this tool, open up the terminal and run the following command: (root@kali:/opt# apt install airgraph-ng).
Before creating a graph of a captured network, first, we need to obtain one. For this, we should put our wireless card in monitor mode.
Ex: (root@kali:/opt# airmon-ng start wlan0).

Use the “airmon-ng check kill” command to disable all active processes before putting the card into monitor mode. To confirm whether our wireless card in monitor mode or not, type the “ifconfig” command and note the interface.

Now, we can capture the network, which is in monitor mode, and dump the results to a specific destination. In this example, we are going to use the “wlan0mon” interface and write the outputs to the “/root/Desktop” directory as a “test.”
Ex: (root@kali:/opt# airodump-ng wlan0mon -w /root/Desktop/test).

To see all captured outputs, navigate to the “/root/Desktop/” directory and run the “ls” command.

Once you confirm that all captured outputs are saved, it is time to create a visual representation of the network. First, we need to stop the monitor mode on our wireless card.
Ex: (root@kali:~/Desktop# airmon-ng stop wlan0mon).
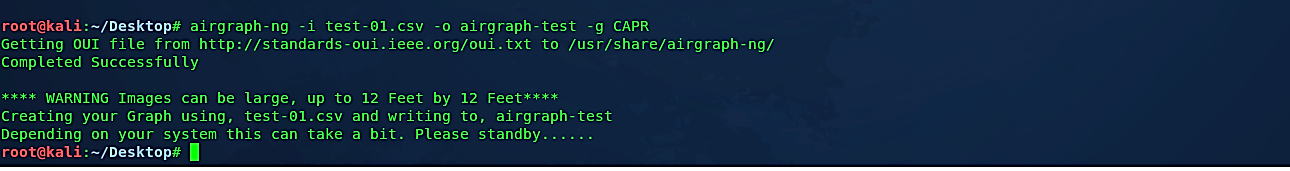
Then run “airgraph-ng” and insert (-i) the captured “.csv” file. To save the graph, use the (-o) option and specify the name of the output file. Lastly, provide the graph (-g) type (CAPR) and hit “Enter” to create a graph.
Ex: (root@kali:~/Desktop# airgraph-ng -i test-01.csv -o airgraph-test -g CARP).
Once the process is complete, your graph will be saved as an image file. You can view it with any image processing software.

As it is shown in the screenshot below, we successfully managed to represent our wireless network visually. Here we can see an example showing the relationship between access points and devices, clearly giving an overview of the local network topography.

Hackers can utilize this data of existing equipment and their association with other devices to craft specific attacks. Since this assault is aloof and requires no association with the system, the danger of being discovered snooping on this data is practically nonexistent.